Browser DevTools as an Essential Tool for API Testing
The DevTools «Network» tab provides almost everything for API testing — from checking responses to making requests.
As a web application test engineer, you need to test the integration of backend (APIs) with frontend (UI in a browser). During this activity, the DevTools «Network» tab should be opened as a «must-have» tool because of the features described below:
- Network Activity
- Request Details
- Advanced Filters
- Content Search
- Disable Cache
- Preserve Log
- Request Blocking
- Edit and Resend Requests (only in Firefox)
- Open in New Tab
- Copy as cURL
Of course, the list can go on and on according to the tasks…
All examples are based on the OpenWether web page; the revealed appid token in some screenshots does not make any security sense.
Network Activity
Network Monitor (in Firefox) or Network Log (in Chrome) on the «Network» tab provides a list of all requests occurring on the page:
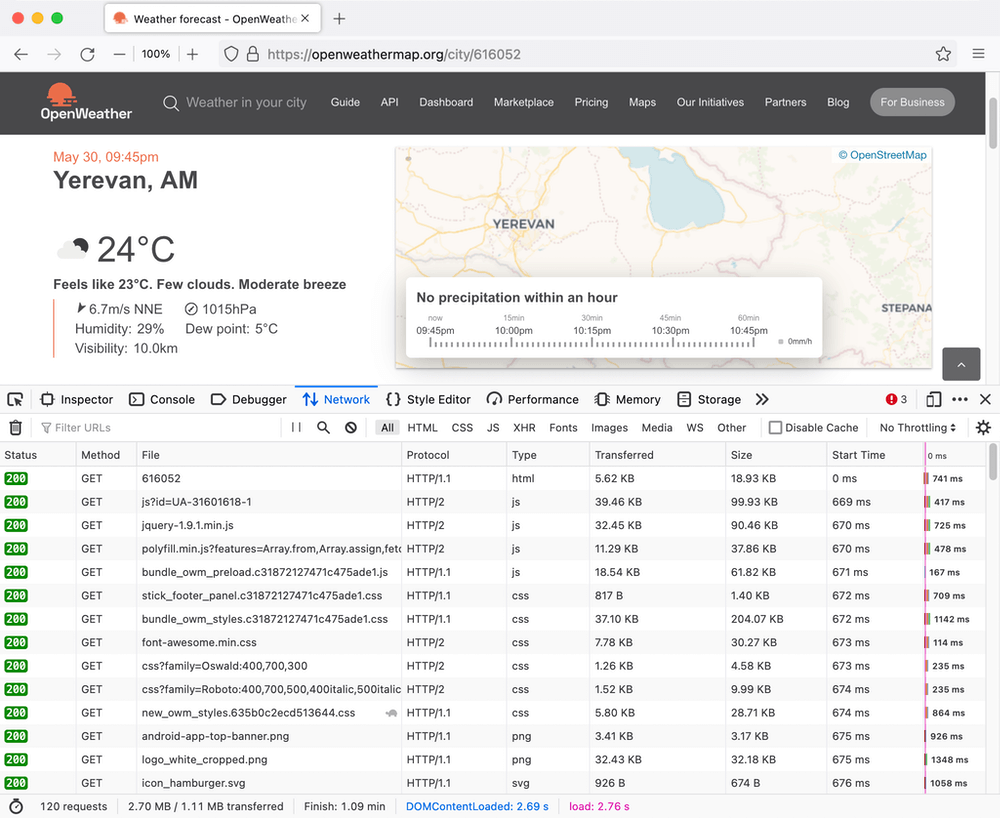
Fig. 1. «Network» tab in Firefox
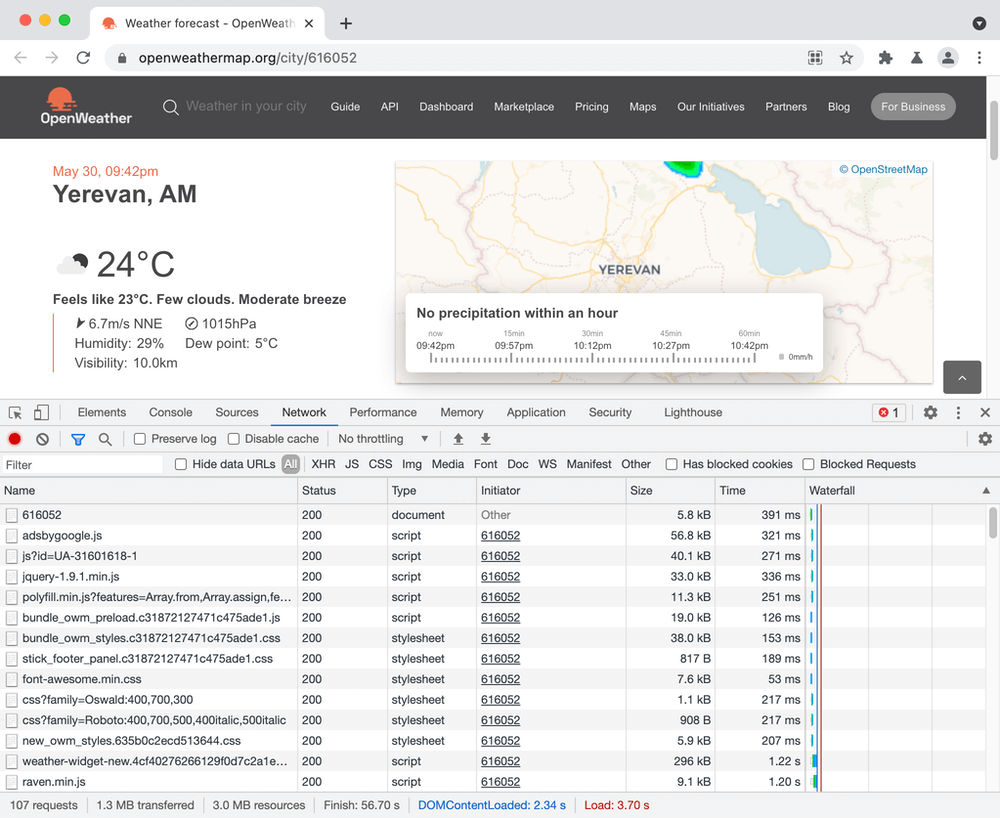
Fig. 2. «Network» tab in Chrome
Depending on the client-server interaction of your web app, you may be interested in XHR requests — most REST API requests are done through it (of course, if your web app is not completely server-side rendered).
There are basic filters by type of request:

Fig. 3. Firefox Network monitor toolbar filters by type (XHR)
Docs:
- Network monitor toolbar (Firefox)
- Filter requests by type (Chrome)
Request Details
All resources from the network monitor/log can be examined for all the elements of the request in the context of API testing: request/response headers and request/response body.
To my mind, Firefox represents details in a nicer format: with text highlighting, filters, raw data view (in Chrome, it calls «View source»), and references to documentation for each header:
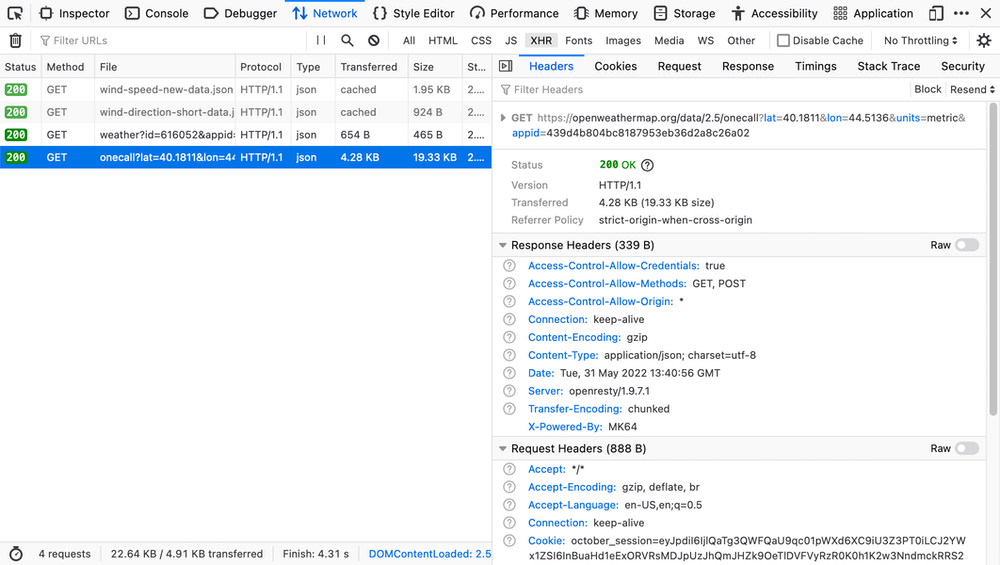
Fig. 4. Firefox header details
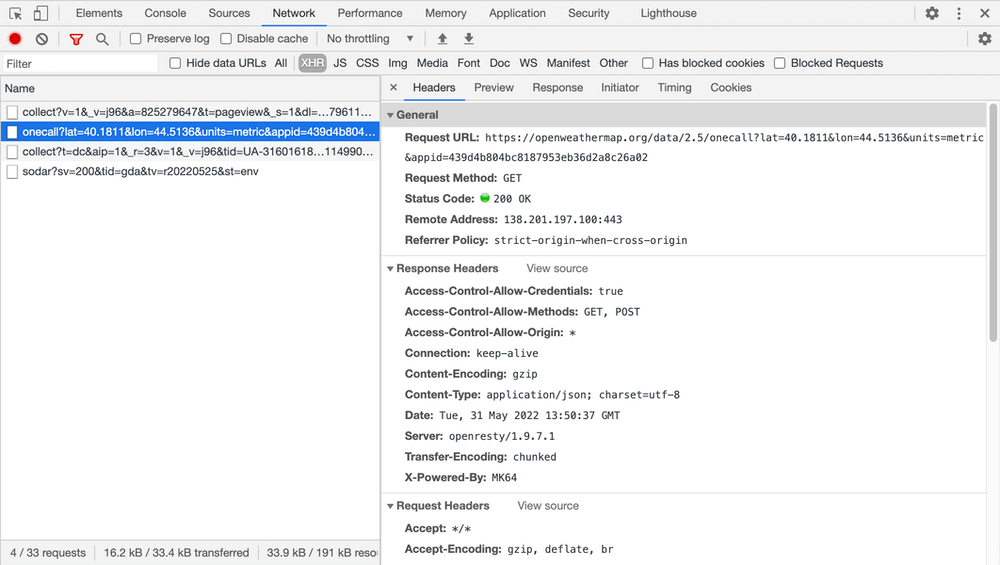
Fig. 5. Chrome header details
The same for response’s body details — Firefox’s built-in JSON viewer highlights syntax and allows filtering. Chrome has only a basic parser on «Preview» tab:
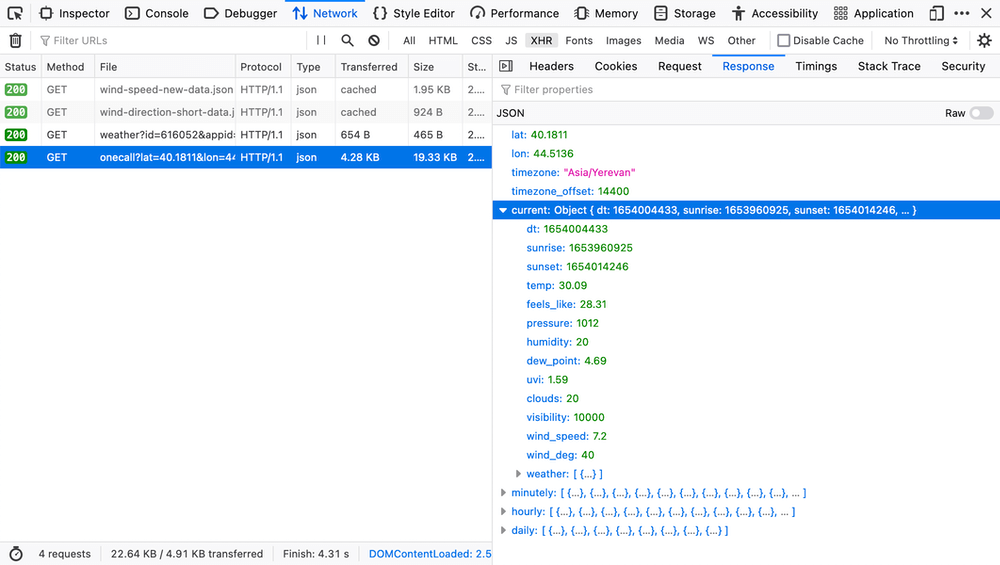
Fig. 6. Firefox response details
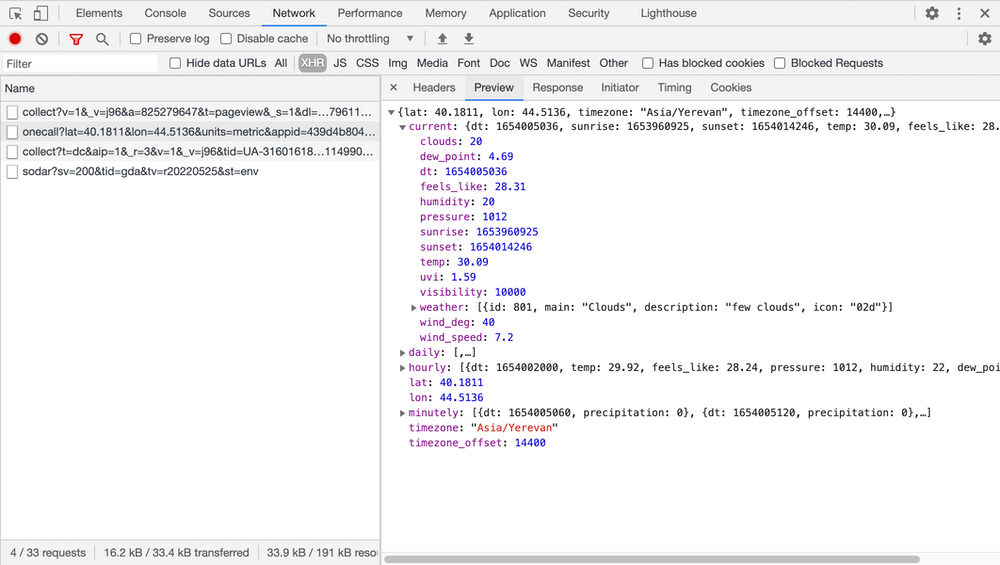
Fig. 7. Chrome response details
Docs:
- Network request details (Firefox)
- Inspect a resource’s details (Chrome)
Advanced Filters
Contemporary web applications make tens of hundreds of requests per page, so it is very important to be able to filter out excess. There are a sufficient number of different parameters available for filtering. For example:
status-code— shows specific HTTP status code —status-code:304method— shows specific HTTP method —method:optionsdomain— shows specific domain —domain:googleapis.com-— negates the filter’s query string —-domain:openweathermap.org(shows all resources not from specified domain);larger-than— shows resources that are larger than the specified size in bytes. You can use suffixkfor kilobytes (1k = 1024 bytes) andmfor megabytes —larger-than:1mis:running— shows incomplete requests. This filter is also good for showing WebSocket resources (if you forgot to set the filter by type in advance).

Fig. 8. Filter JSON data in Firefox — mime-type:application/json
Docs:
- Filtering by properties (Firefox)
- Filter requests by properties (Chrome)
Content Search
Unlike the query filter through requests, «Search» runs a full-text search through headers and content:
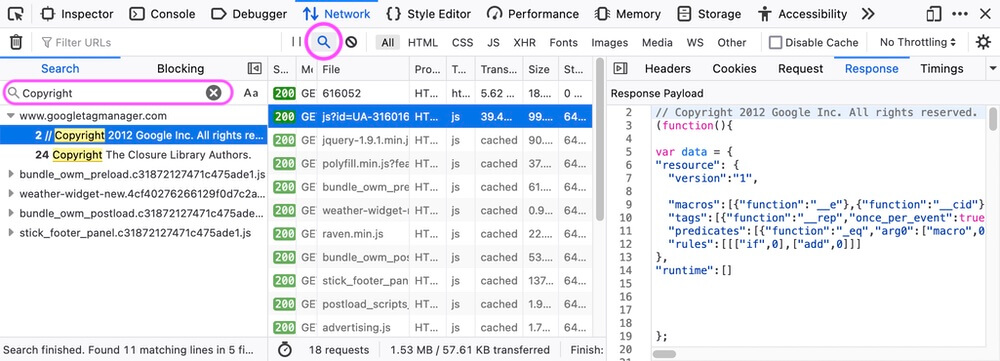
Fig. 9. Search content in responses in Firefox
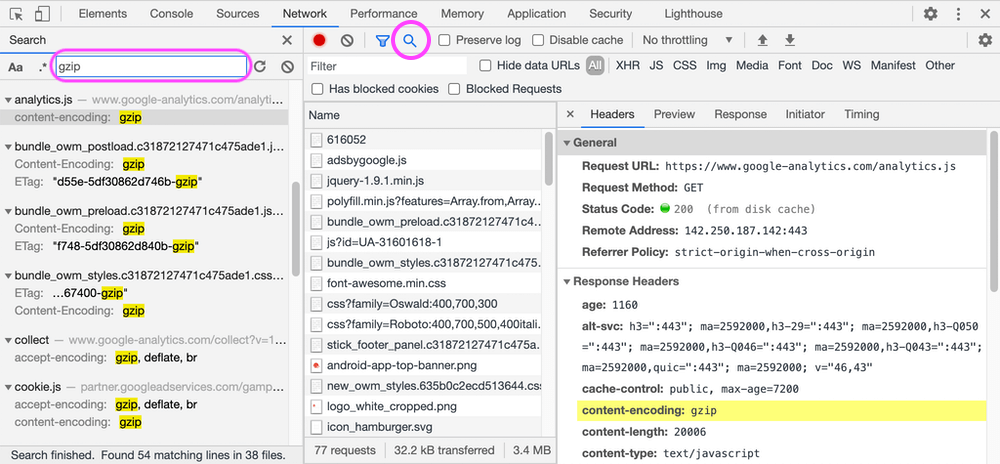
Fig. 10. Search content in headers in Chrome
Docs:
- Search in requests (Firefox)
- Search network headers and responses (Chrome)
Disable Cache
Browsers like to cache responses to improve performance and efficient traffic utilization (they can be filtered by is:cached) for the next page load:
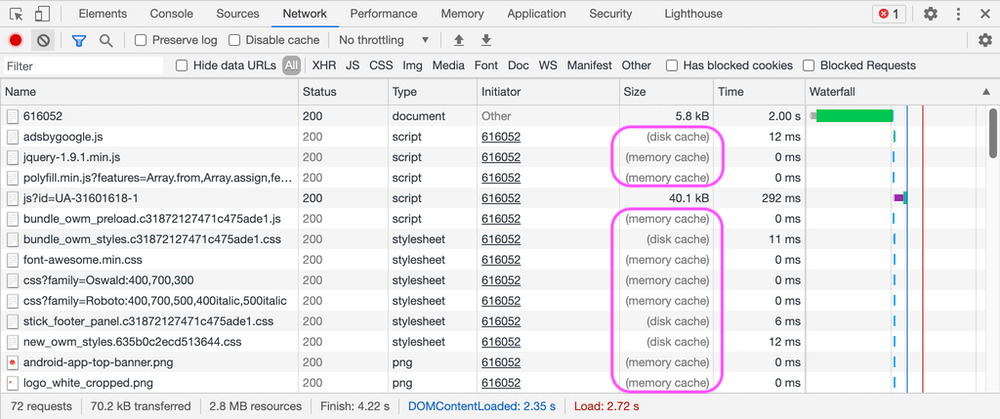
Fig. 11. Cached resources in Chrome
Use «Disable Cache» to prevent caching — all resources will be requested as at the first time.

Fig. 12. Disable Cache checkbox in Firefox
Docs:
Preserve Log
If you have to refresh the page in order for testing or your test page makes redirects or auto-refreshes, the network activity is cleared each time the page reloads. Enable «Persist Logs» (in Firefox) or «Preserve Log» (in Chrome) to save all requests across page loads (they will be saved until you disable them).
![]()
Fig. 13. In Firefox this setting is hidden inside the gear icon

Fig. 14. Preserve log checkbox in Chrome
Docs:
- Network monitor toolbar (Firefox)
- Save requests across page loads (Chrome)
Request Blocking
Blocking requests is more demanded for frontend rather than backend testing, but at least this feature is quite useful — you do not need third-party proxies to do it.
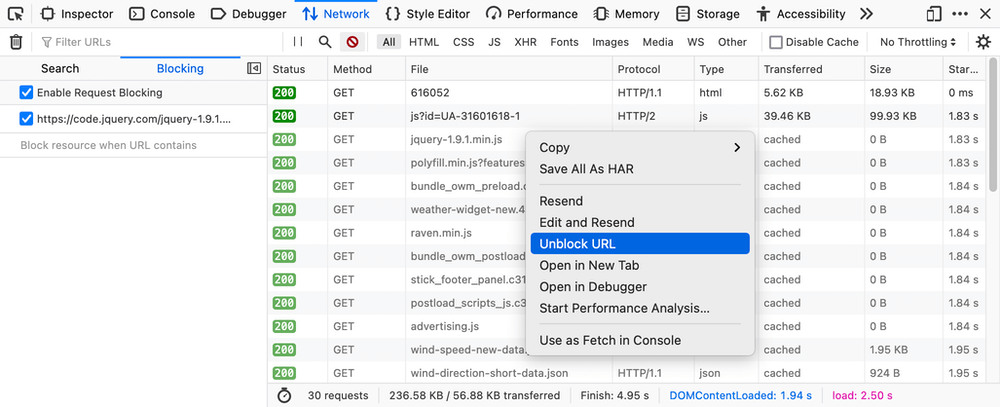
Fig. 15. Blocking in Firefox
Chrome allows you to block by URL and by domain. In the «Network request blocking» panel, you can edit blocking rules by patterns and wildcards (very convenient to block trackers):
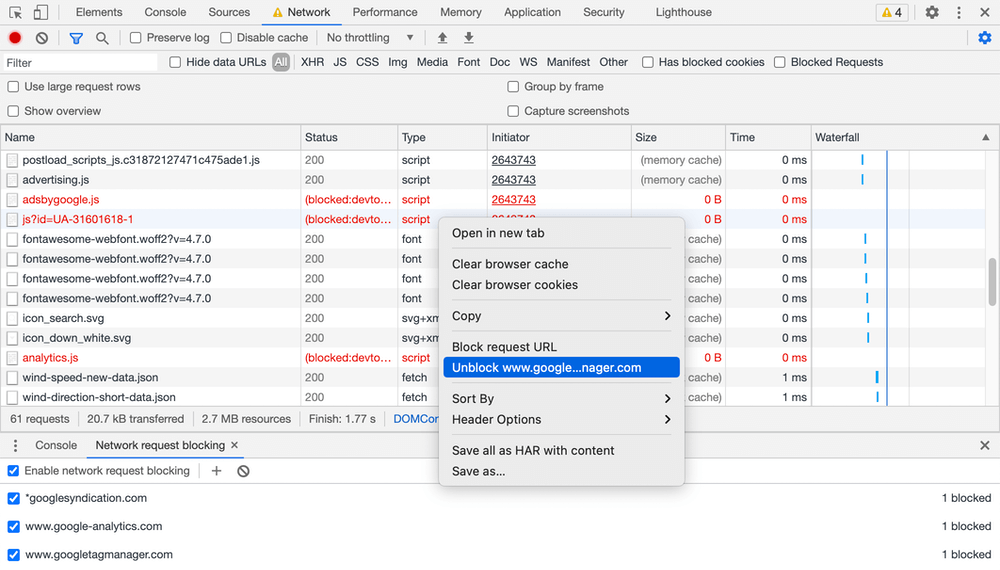
Fig. 16. Network request blocking in Chrome
All blocked requests will be highlighted and can be easily filtered in both DevTools (Firefox and Chrome).
Docs:
- Blocking specific URLs (Firefox)
- Block requests (Chrome)
Edit and Resend Requests (only in Firefox)
This magnificent feature is not sufficiently covered in the documentation, but it is incredibly useful for API testing or debugging. You can take any request (even POST and other methods that modify data), edit it, and resend it on behalf of the page!
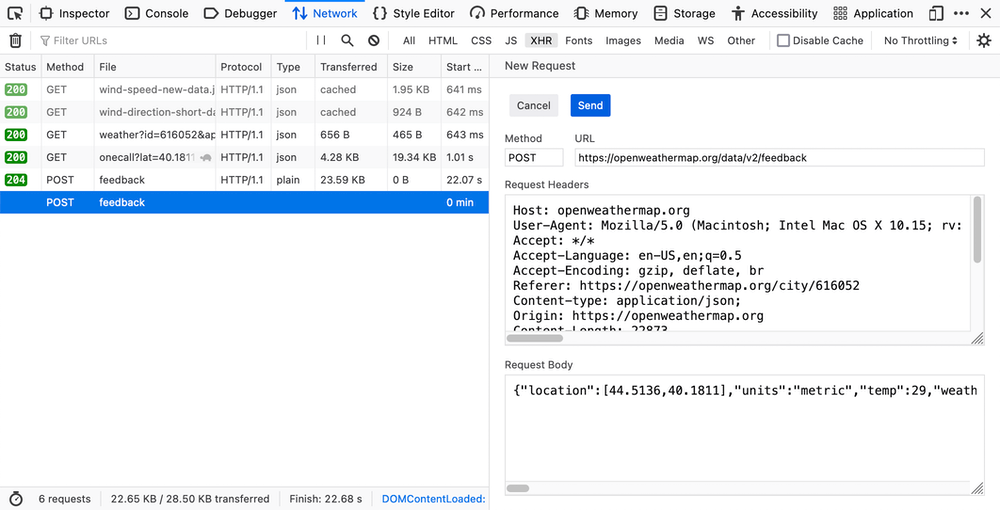
Fig. 17. «New Request» form in Firefox
Open request details on «Headers» tab → Resend → Edit and Resend → [Send] the «New Request» form:
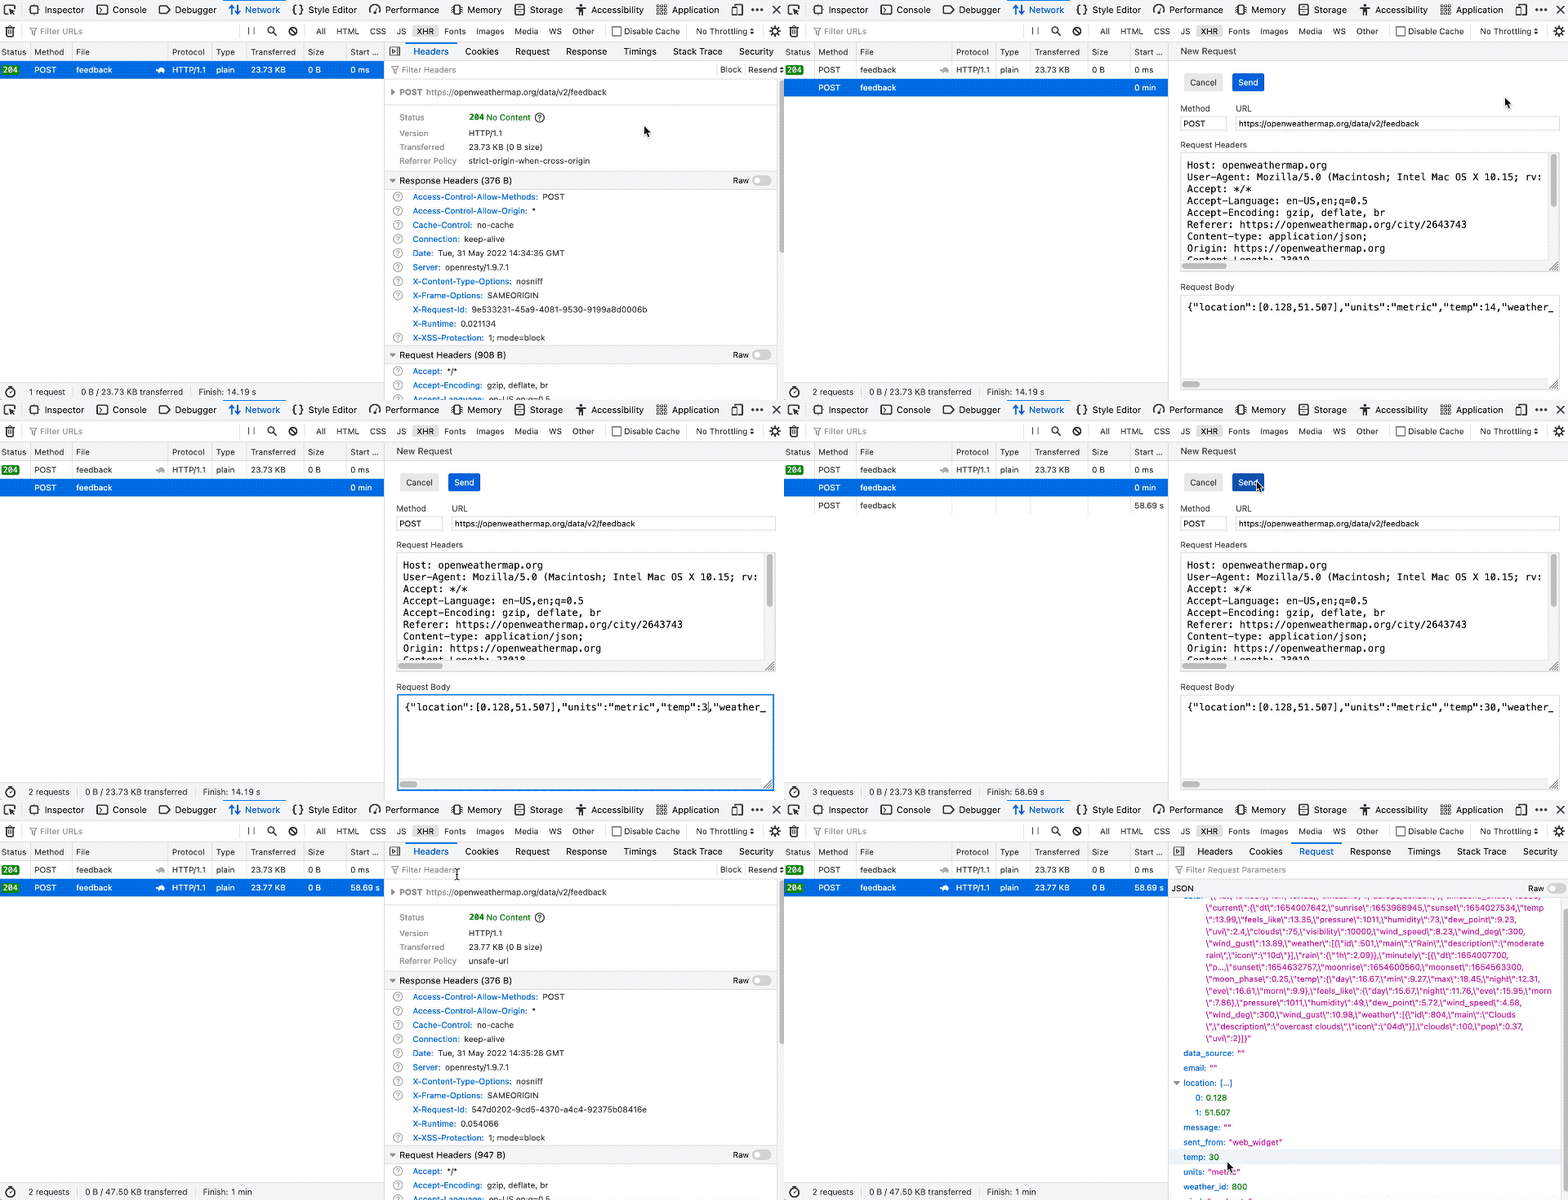
Fig. 18. Edit and resend request in Firefox
From the same context menu, you can also resend requests without modification (maybe if you want to test the handler for idempotence).
Docs:
- Context menu (Firefox)
Open in New Tab
You can resend any request in a new browser’s tab for further inspection of the body (in case of API requests) or for downloading scripts, fonts, images, and other content:
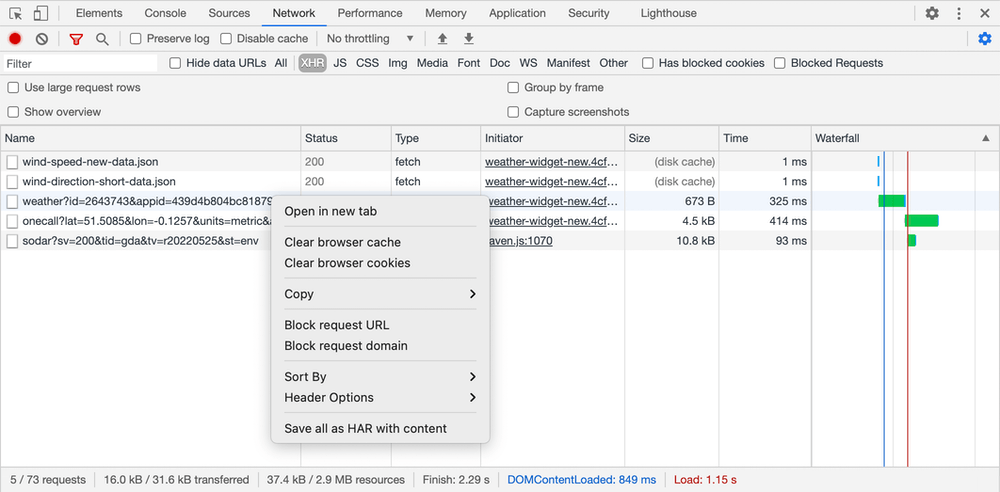
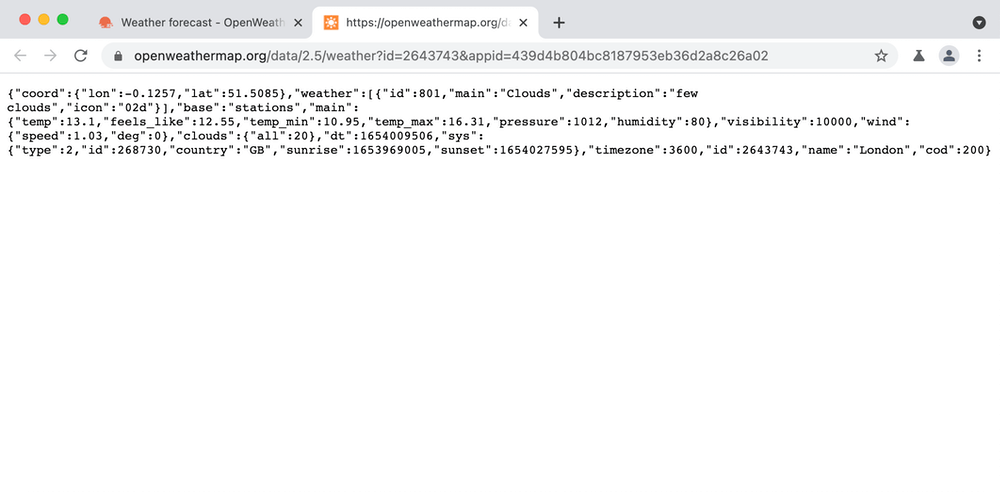
Fig. 19 & 20. Open in a new tab in Chrome
Firefox’s way of showing API requests in a new tab again is nicer than Chrome’s — there are JSON viewer and info about headers:
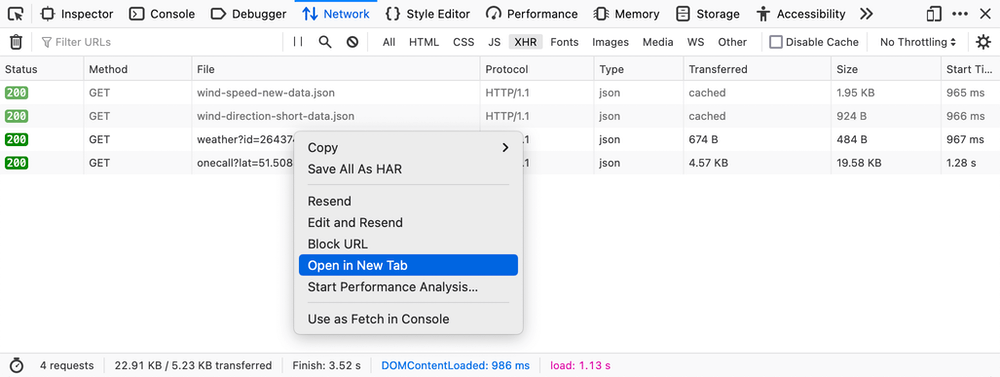
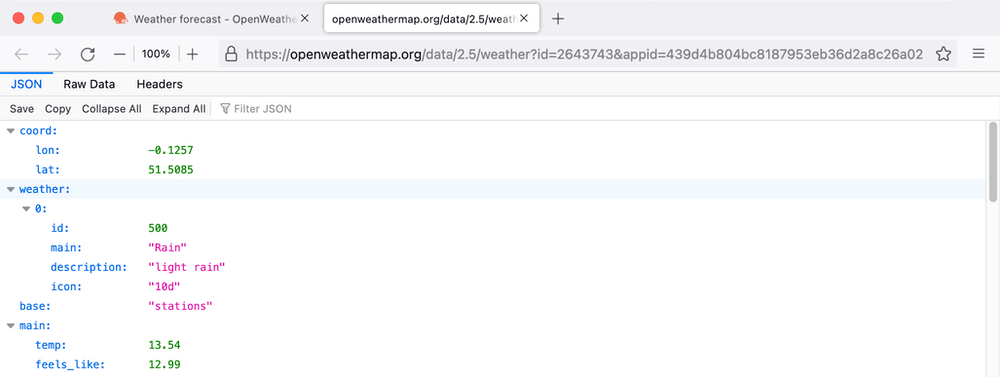
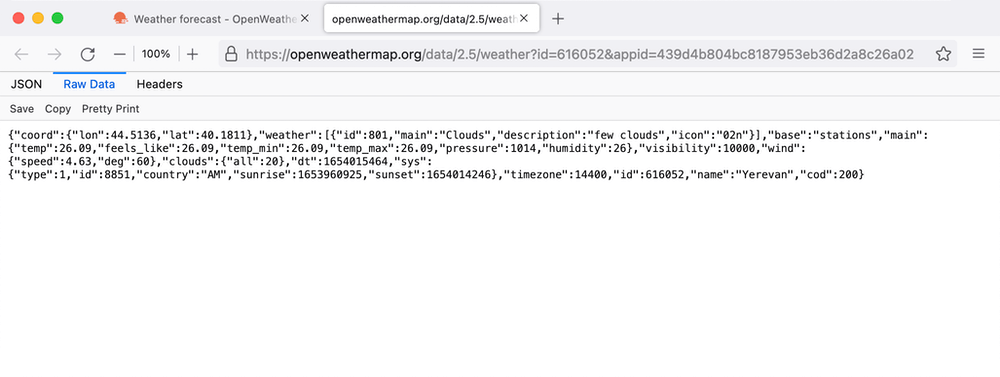
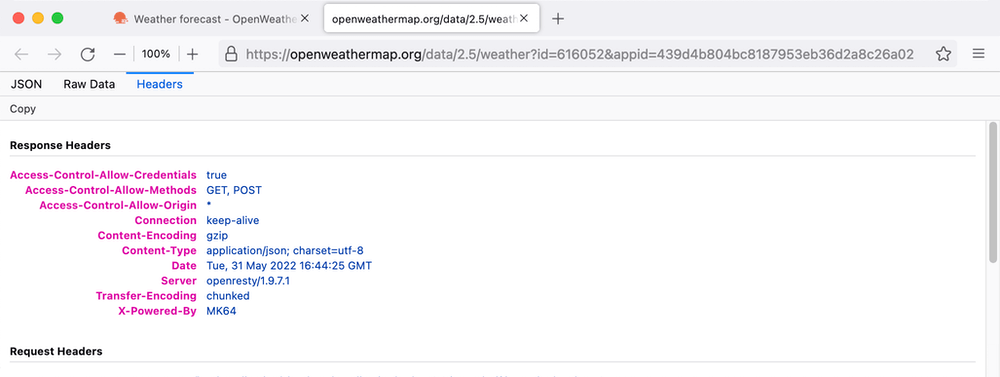
Fig. 21–24. Edit and resend request in Firefox (with proofs)
Take a closer look at the screenshots: thanks to developers for the [Copy] buttons — it saves time.
Copy as cURL
For testing API through other tools, you can copy requests in cURL format exactly the same as a browser does:
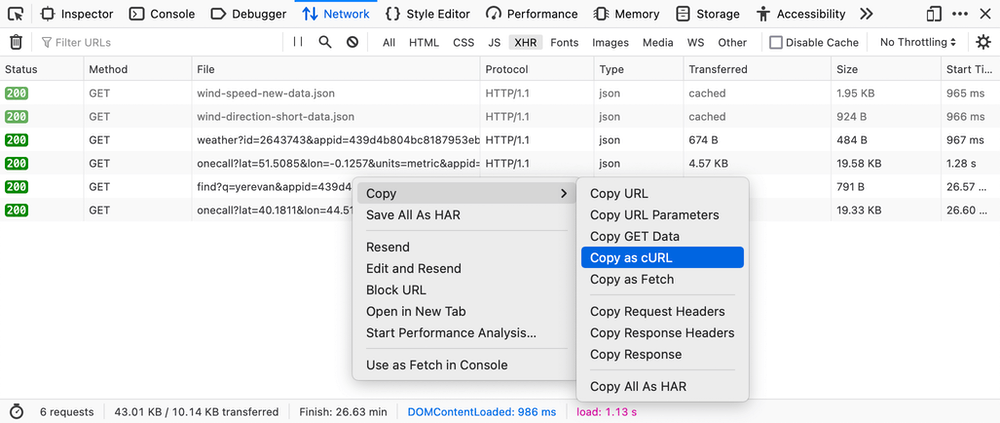
Fig. 25. Copy as cURL in Firefox
The result of copying to the clipboard:
curl 'https://openweathermap.org/data/2.5/weather?id=2643743&appid=439d4b804bc8187953eb36d2a8c26a02' -H 'User-Agent: Mozilla/5.0 (Macintosh; Intel Mac OS X 10.15; rv:100.0) Gecko/20100101 Firefox/100.0' -H 'Accept: */*' -H 'Accept-Language: en-US,en;q=0.5' -H 'Accept-Encoding: gzip, deflate, br' -H 'Referer: https://openweathermap.org/city/2643743' -H 'DNT: 1' -H 'Connection: keep-alive' -H 'Cookie: october_session=eyJpdiI6IlpYR1NmbEpJRUk2RDhHZkRsNVVZR2c9PSIsInZhbHVlIjoiRDBxbW9NdmdoSkdtV2FCVmwxUWZDY2hJSkpMcWIrN2xqMW14NXZmSXloTkwwVzdPMXE0UzdhRDg1VThFVWVpMFlna1FIcW9Tb1kzcnJUdHZJZlgxRjNCUHRCRXNDTHRRTjZCNzlRQUZqelVQV0gyOENkenRtVWpjc09ERW11SHEiLCJtYWMiOiI1NDYyM2RiMTM3MTZmNTgxMjJmY2QxMDRhM2Y1MjU2MTgwZWE3ZWIyOGQzMjg2MGE3ZjA3NGExMDMxNDg3OTRlIn0%3D; units=metric; stick-footer-panel=false; cityid=2643743' -H 'Sec-Fetch-Dest: empty' -H 'Sec-Fetch-Mode: cors' -H 'Sec-Fetch-Site: same-origin'
Besides cURL, Chrome has more options for copy:
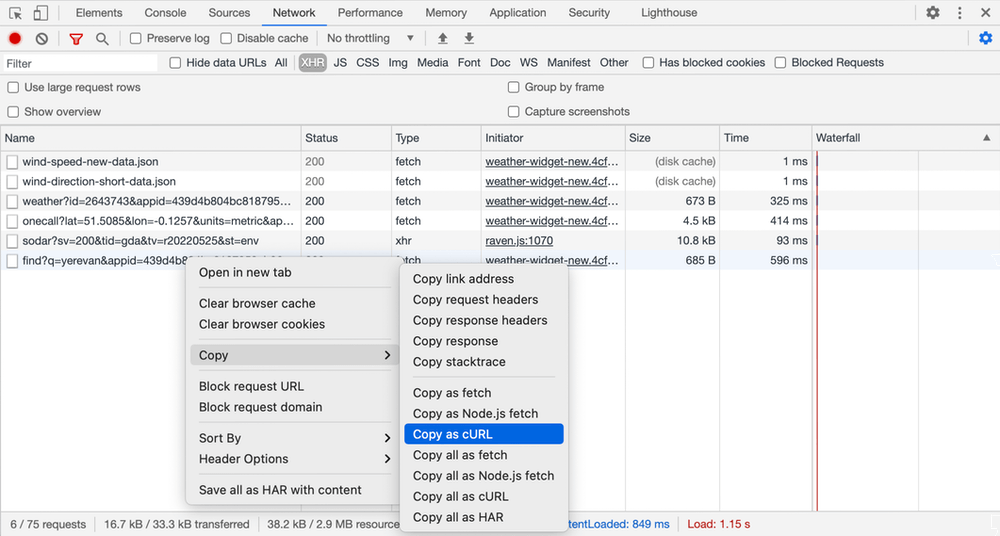
Fig. 26. Copy as cURL in Chrome
Docs:
- Copy as cURL (Firefox)
- Copy one or more requests to the clipboard (Chrome)
I hope that the reader knows why he needs a cURL and how to use it:
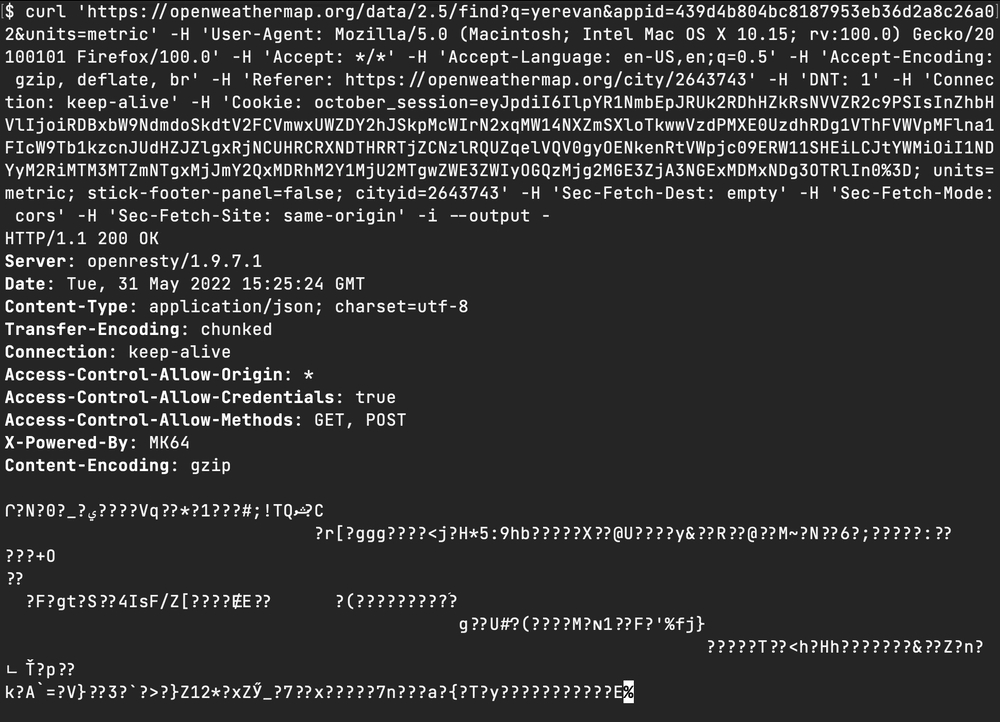
Fig. 27. cURL request in Terminal
In the example above I added -i --output - to cURL request to show response headers and binary output.
For more tricks, see DevTools Tips.
Copy @ Medium